Category Archives: Weather & Sky

How Heavy is a Cloud? and Other Weighty Subjects

Cloud on a scale (image from USGS)

11 October 2023

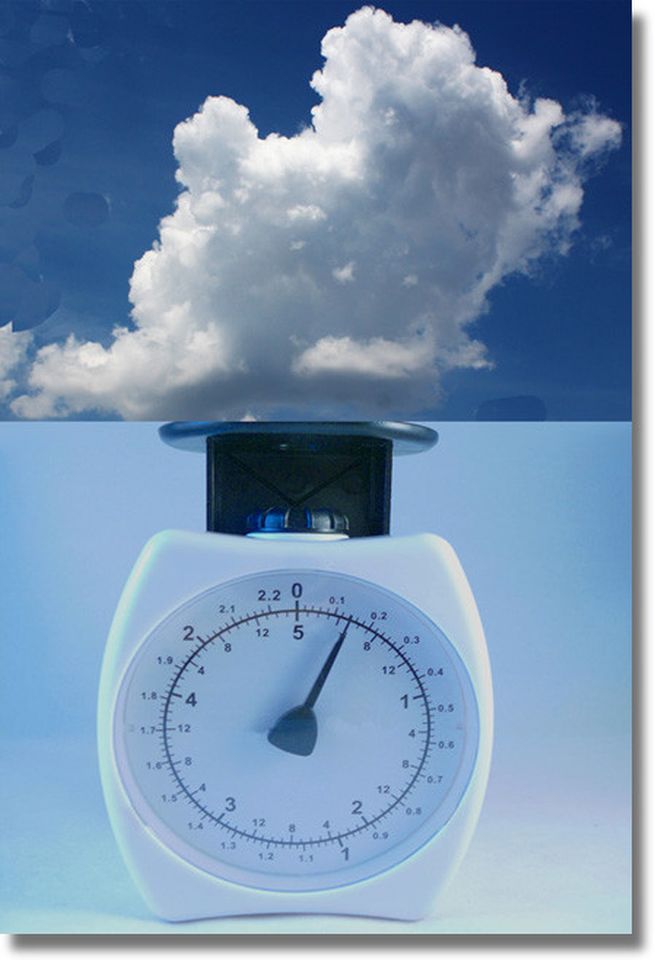
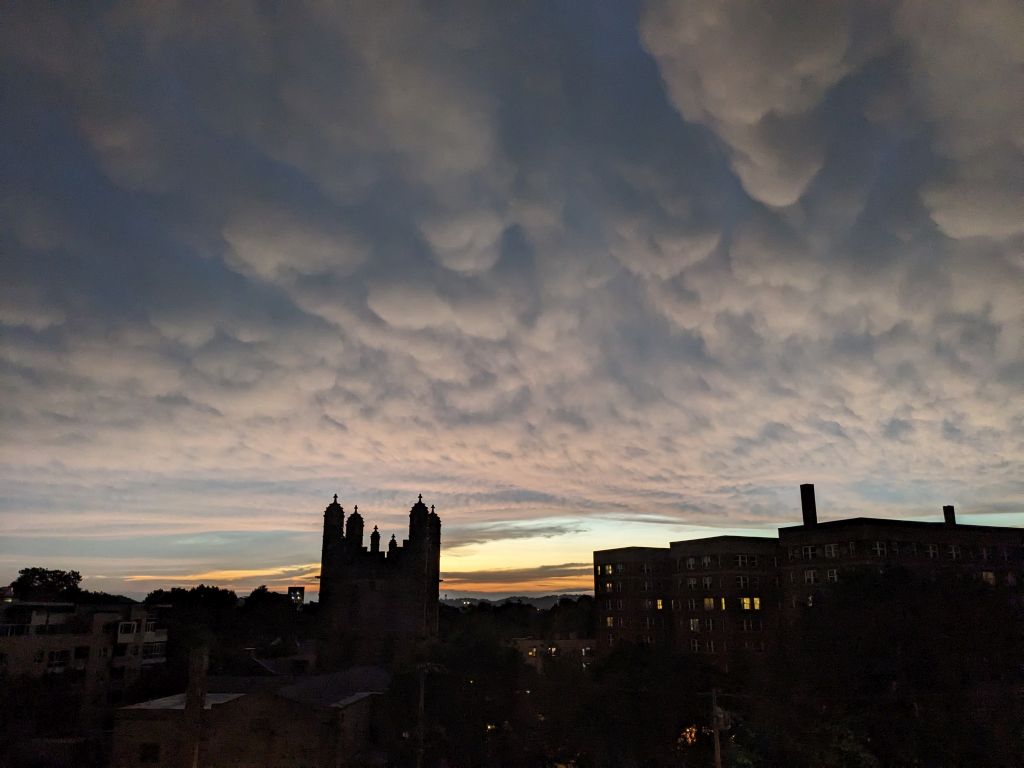
How heavy is a puffy white cloud? It depends on how big it is.

According to USGS, an average 1 kilometer by 1 kilometer cumulus cloud weighs about 1.1 billion pounds.

Notice that this calculation uses the metric system for the cloud’s dimensions because it’s so much easier to calculate the weight of a cloud using those units.

When the metric system began in France in the 1790s, the units had Earth measurements as their basis. A kilogram was the mass of water in a 10cm x 10cm x 10cm container (a litre). The cloud answer, above, was calculated in metric and expressed in kilograms, then translated to U.S. customary pounds.

Did you know that we use two measuring systems in the U.S.? Everyday things are described in U.S. customary measures (inches, feet, pounds) but, as described in Wikipedia, science, medicine, electronics, the military, automobile production and repair, and international affairs all use the metric system. Also, most packaged consumer goods in the U.S. have to be labeled in both customary and metric units.

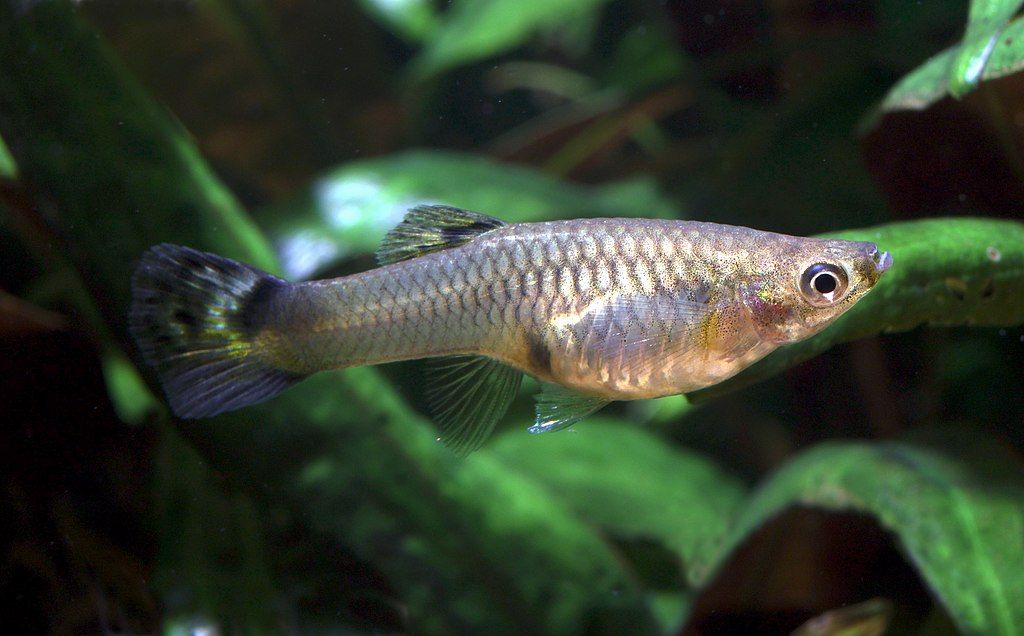
All birds are measured in grams and centimeters. I can tell this common yellowthroat is being banded in the U.S. because there are inches on that ruler. But his tail is about 4.5cm.

Bird banding, common yellowthroat in hand (photo from Wikimedia Commons)

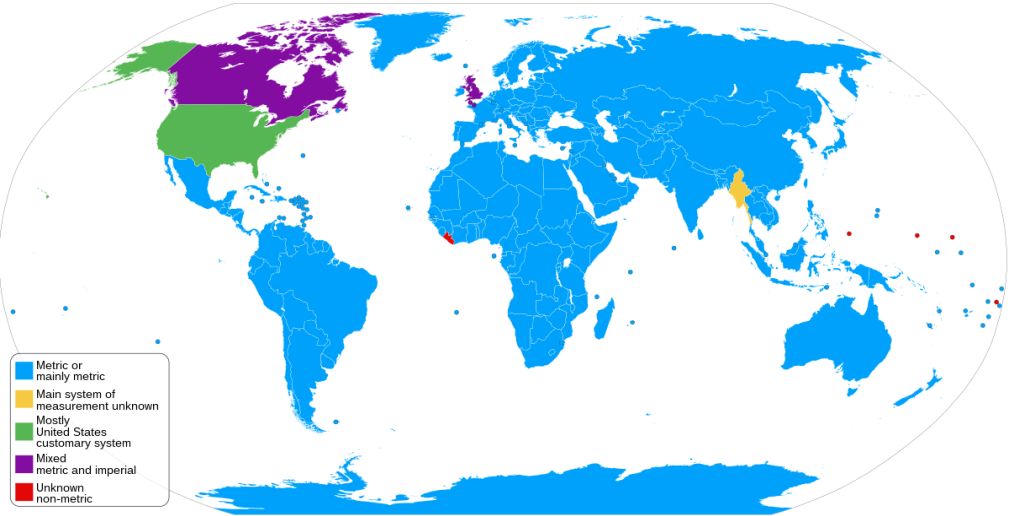
The U.S. is one of three major countries that do not universally use the metric system.

Map of metric and Imperial measuring systems from Wikimedia Commons

Why haven’t we completely adopted the metric system?

It comes down to three things: Time, Money and Congress. The change will cost time and money for U.S. industry, and designating an official measurement system requires an act of Congress. Whenever the subject comes up, lobbyists convince Congress to say “No.”

So for now we use two measuring systems.

p.s. Grams and pounds do not measure the same thing at all. Grams are a measure of mass (a fundamental property of matter). Pounds are a measure of force (the force of gravity on a mass).

If your mass is 68 kilograms, you are …
68 kg in Europe
150 pounds in the U.S.,
25 pounds on the Moon and still 68 kg,
0 pounds in outer space and still 68 kg
Your mass is 68 kg everywhere you go.

Read more here in Science News Explores: Explainer: How do mass and weight differ?

(credits are in the captions; click on the captions to see the originals)

Today Is Not the Equinox

Sunset is due west on the equinox, North Dakota Hwy 5 (photo from Wikimedia Commons)

21 September 2023

Are we there yet? Have we reached the equinox?

In Pittsburgh the winter solstice invariably arrives on 21 December, but the 21st never works for the autumnal equinox.

As an astronomical event, the equinox arrives everywhere on Earth at exactly the same moment but is expressed as different dates and times because of longitude and time zones. Hawaii’s equinox is on the 22nd while Paris and Johannesburg have the same date and time because of time zones.

Universal Time23 Sep, 6:50AM UTC
Pittsburgh23 Sep, 2:50AM EDT
Honolulu, HI22 Sep, 8:49PM HST
Tokyo23 Sep 22, 3:49PM JST
Paris23 Sep, 8:49AM CET
Johannesburg, SA23 Sep, 8:49AM SAST

For most of the Earth this month’s equinox will occur on the 23rd. When it does everyone’s sunset will be exactly west, just like the photo above.

Learn how this works at …

(photo from Wikimedia Commons)

Seen This Week

Turtleheads blooming in Schenley Park, 3 Sept 2023 (photo by Kate St. John)

9 September 2023

Seen this week:

Turtleheads and late boneset flowers at Schenley Park. Do you see the honeybee?

Honeybee flies to late boneset, Schenley Park, 4 Sept 2023 (photo by Kate St. John)

A rainbow with crows over Oakland.

Rainbow over Shadyside on 7 Sept 2023 (photo by Kate St. John)

Fiery sunset on 7 September.

Fiery sunset on 7 Sept 2023 (photo by Kate St. John)

Six deer in Schenley Park — only 5 made it into the photo.

Five of six does in Schenley Park along the Bridle Trail, 4 Sept 2023 (photo by Kate St. John)

But there’s a photo of deer I wish I’d been able to take: Friday morning 8 September along 5th Ave between the Cathedral of Learning and Clapp Hall I saw 3 deer — 2 does and 1 fawn — standing on the pavement at Clapp Hall. They were close to the curb of 5th Ave at Tennyson as they tried to figure out how to cross 5th Ave during rush hour.

(photos by Kate St. John)

p.s. Right now there are 2 flamingos in PA in Franklin County east of Chambersburg.

What If The Stars Stood Still?

Milky Way at Bontecou Lake, Duchess County, NY (photo from Wikimedia Commons)

8 September 2023

When we watch the sky at night, we see the stars and planets wheel above us as they rise and set.

But what if we were standing among the stars? What if the stars stood still and we could tell that the Earth was moving?

Astrophotographer Bartosz Wojczynski set up his camera on a Sky-Watcher Star Adventurer mount that automatically canceled out the Earth’s rotation. In his video the stars stand still.

video from AmazeLab on YouTube

Are you dizzy yet?

(credits are in the captions)

Flamingos Have Been Popping Up All Over

3 September 2023

Except for a few rare sightings in Florida, flamingos seen in the U.S. are not from the wild, they’re escapees from a zoo. Then suddenly last week, after Hurricane Idalia, flamingos have been popping up all over.

At top, 16 flamingos visited Fred Howard County Park near Tarpon Springs, FL. Below, 6 flamingos stopped by St. Mark’s National Wildlife Refuge, 30 miles south of Tallahassee.

The groups have often been a mix of pink adults and gray youngsters.

As of Saturday evening the totals were:

  • 100+ in Florida
  • 11 at Pea Island, North Carolina
  • 2 in South Carolina
  • 2 in Virginia
  • 3 in Alabama
  • 5 in Tennessee
  • UPDATE on 4 Sep 2023: 1 in Kentucky
  • and 2 in OHIO! at Caesar Creek State Park. These were seen for only a day and then gone.
  • UPDATE on 7 Sept 2023: 2 flamingos in Franklin County, PA pictured below: First reported on eBird on 7 Sept but apparently present for 2 days prior as well.

American flamingos (Phoenicopterus ruber) are native to the northern shore of South America, the Caribbean islands, Cuba, and the Yucatan in Mexico. Hurricane Idalia plowed through a few of those locations.

Range map of American flamingo (Phoenicopterus ruber) from Wikipedia

This WKRG video on 27 August shows Hurricane Idalia gaining strength as it spans the Caribbean, overlaying part of the Yucatan and all of Cuba. The flamingos would have felt it coming and flown north and northeast to get out of its way. Notice the lower speed winds (shades of green) on the edge of the weather map. The green wind track is where most of the flamingos have been found.

video from WKRG News on YouTube

Considering the storm track, the flamingos are probably from Cuba and the Yucatan including at least one banded bird.

Given all the discussion about the flamingos now appearing all over Florida (and farther north), this eBird list from Amy Grimm is especially relevant. This afternoon, Grimm documented 8 flamingos at Marathon, in the Florida Keys, and noted that “One has large yellow band on the right leg code DXCL, small silver band on left leg.” Do the bands mean it’s escaped from captivity? No. This combination — yellow PVC band on one leg with 4-letter code in black letters, ordinary band on other leg — has been used for years in the ongoing project to band American Flamingos in the big colony at Rio Lagartos, on the north coast of Mexico’s Yucatan Peninsula.

Kenn Kaufman at ABA Rare Bird Alert Facebook Group

Flamingo sightings will end as the birds head home. For now, enjoy them in videos.

video from Tampa Bay Times on YouTube
video embedded from @10TampaBay on YouTube

(credits are in the captions)

Literally Outside My Window

Sunrise with mammatus clouds, Pittsburgh, 29 July 2023 (photo by Kate St. John)

5 August 2023

Some amazing things were quite literally outside my window last week.

Above, nearby thunderstorms at sunrise on 29 July produced these ominous mammatus clouds.

Two days later a complete rainbow with purple arcs filled the sky. The purple is too faint to see in this photo.

Rainbow in Pittsburgh, 31 July 2023 (photo by Kate St. John)

It was also a week of large flying insects.

Larger elm leaf beetles (Monocesta coryli) have been flying by 60 feet above the pavement. This one rested on my window.

Larger elm leaf beetle, 29 July 2023 (photo by Kate St. John)

And spotted lanternfly adults (Lycorma delicatula) fly higher than you’d think. Their numbers increased dramatically in the past week.

Spotted lanternfly outside my window, 2 August 2023 (photo by Kate St. John)

No one’s talking about wildfire smoke but something was causing Code Orange air on Thursday. Air quality improved long before sunset.

Sunset, 3 August 2023 (photo by Kate St. John)

(photos by Kate St. John)

The Heat Loop

Hot weather sunset (photo from Wikimedia Commons)

26 July 2023

The weather is hot and getting hotter. Excessive heat plagued the West, Texas and Florida and now, in the next 6-10 days, the heat will move southeast with soaring temperatures at 100°F+.

U.S. 6-10 day temperature outlook, 31 July – 4 August as of 7/25/2023 (map from NWS)

It’s not just the air that’s hot, the ocean is too. This timelapse video from Colin McCarthy @US_stormwatch shows ocean temperature anomalies from 22 February to 21 July. The hottest colors — the highest above normal — are off the Pacific coast of South America and in the North Atlantic near Newfoundland.

Warming water off the coast of South America is the developing El Niño, part of the cyclical El Niño–Southern Oscillation (ENSO) that affects weather and climate around the world.

The real surprise is off the coast of Newfoundland where Colin McCarthy says “The North Atlantic is in uncharted territory. The entire ocean basin is a record-smashing 1.5°C (2.7°F) above normal.”

Both are easier to see in this static map from NOAA.

NOAA sea surface temperature anomaly (partial map) as of 24 July 2023, 0600 EDT

Hot water makes the air hot as Newfoundlanders can tell you. Summers are usually so cool there that only 1 in 5 households in St John’s, NL have air conditioning, at least as of 2019. That is probably changing this summer as temperatures soar into the 90s.

Hot water makes hotter air makes hotter water in an endless feedback loop.

With El Niño on top of climate change I don’t think it will end well.

p.s. Today’s news Florida ocean records ‘unprecedented’ temperatures similar to a hot tub!

(photo and map credits are in the caption; click the links to see the originals. The Heat Loop diagram is by Kate St. John)

Check the Air for DNA

DNA of giraffe and elephant were both detected in the air outside Copenhagen Zoo (photos from Wikimedia Commons)

18 July 2023

We’ve been paying attention to air quality this summer as Canadian wildfire smoke blows into town. The smoke that reaches us, called smog or soot in the chart below, is labelled PM2.5 by air monitors (the particles are less than 2.5 micrometers in diameter). As you can see there’s a lot of other stuff in the air that the monitors are not analyzing — but they could. In the past few years scientists have discovered that we can check the air for DNA.

Atmospheric particulate matter, types and sizes in micrometres (?m) (diagram from Wikipedia) The diagram has been updated to show PM2.5 with a red line

In 2020 an environmental DNA (eDNA) study in water led to eDNA studies in the air when a fish inventory compared trawling surveys (shown below) to DNA analysis of seawater samples. Science Magazine reported, “Overall, the team found about a 70% match between species abundance recorded by eDNA and trawls.”

Fishery biologists and deckhands working up a big tow on the F/V Excalibur. All catches
are first divided into baskets by species. Photo: NOAA Fisheries

In 2021 Mark Johnson, a graduate student at Texas Tech, realized that pollen and plant fragments are such a big component of air quality that he decided to compare manual plant surveys to eDNA measurements at Texas Tech University’s Native Rangeland.

The two methods complemented each other. Manual surveys detected 80 species while eDNA found 91 using the devices pictured below. According to Science Magazine, “eDNA was better at finding easily overlooked species with small flowers, such as weakleaf bur ragweed. But people were better at spotting plants too rare to release much eDNA, particularly when they had showy flowers, such as the chocolate daisy.”

The Big Spring Number Eight dust traps that were used to collect airborne eDNA (photo from Mark Johnson’s studay at Texas Tech)

It was only a matter of time before similar air monitoring was used to detect animals.

Two recent studies — one in the UK, the other in Copenhagen — collected and analyzed air samples for animal DNA. And they found it. To prove their equipment, each study located air samplers near a zoo and both found zoo animal DNA. According to NPR, the Copenhagen study “picked up 49 animal species including rhinos, giraffes and elephants. ‘We even detected the guppy that was living in the pond in the rainforest house.'”

Guppy (photo from Wikimedia Commons)

And so we’ve come full circle from detecting fish DNA in water to detecting it in the air.

Read more about the animal eDNA studies at WESA-FM: Scientists vacuum zoo animals’ DNA out of the air.

p.s. There is speculation that this technique could help us inventory endangered species.

(photo credits are in the captions; click on the links to see the originals)

Bad Air Returns

  • Cathedral of Learning from CMU, 29 June 2023 (photo by Kaleem Kheshgi)

17 July 2023

When Canadian wildfire smoke swept into Pittsburgh in late June it gave us two and a half days of terrible air quality, then dissipated suddenly on 30 June. Kaleem Kheshgi captured the stark contrast from smoke to clear in photos on 29 and 30 June. Even as the smoke dispersed meteorologists warned that it could and would return because the fires are still burning.

Today their prediction comes true. Wildfire smoke from Alberta and British Columbia has blown into the U.S. and caused Code Red air quality alerts yesterday from Montana to Michigan and Kentucky.

AirNow interactive air quality map on Sunday 17 July 2023 as of 4pm EDT (screenshot from AirNow.gov)

Pittsburgh was in the clear at the time but not anymore. At 5am today Pittsburgh was already in Code Orange and the red zone was approaching. Cleveland and Buffalo are among the many locations in red. (Pittsburgh is marked with a * on these maps.)

Regional air quality on 17 July 2023 at 5am from AirNow.gov (Wisconsin to Kentucky, Missouri to Cape Cod)

Code Orange will force some of my friends indoors today. Code Red is bad for everyone.

A code ORANGE air quality alert means that air pollution concentrations within the region may become unhealthy for sensitive groups. Sensitive groups include children, the elderly, and people suffering from asthma, heart disease, or other lung diseases. The effects of air pollution can be minimized by avoiding outdoor exercise or strenuous activity.

A code RED air quality alert means that air pollution concentrations are unhealthy for the general population.
National Weather Service Alert

A look at some individual monitors on the AirMatters app tells the story at 6:30am. I’ve set my app to look at Pittsburgh, plus local monitors near Frick Park (“Forest Glen”), Carlow University and one of several monitors in Homestead.

Today’s forecast says we’ll be in Code Orange but the Red Zone is so close that we will probably see Red spikes before rain and thunderstorms clear it out late this afternoon/evening.

Check your own air quality at AirNow https://www.airnow.gov/. Download the AirMatters app at the Apple Store or Google Play.

(photos by Kaleem Kheshgi, maps from AirNow.gov)

Drought: The Long and Short of It

View of South Mountain from Queen Creek, AZ (photo from Wikimedia Commons)

12 July 2023

Short term:

Last Friday, 7 July, Pennsylvania was placed under a statewide drought watch by the PA Department of Environmental Protection. They evaluated four factors to make the decision: precipitation, surface water flow, groundwater level, and soil moisture. The most worrisome was low groundwater in 16 counties and a 90-day rain deficit in Elk and Warren.

And then it rained in central and eastern PA and the Drought Condition map changed. Most of the state is now in the green (good) or yellow zone. Except for low groundwater in 14 of our 67 counties, the drought appears to be short term because a good rain can clear it up. See the Before and After, July 9 and 11, in this slideshow.

USGS Pennsylvania Drought Condition monitoring as of July 9 and 11, 2023

Long term:

Meanwhile, Arizona is not in a drought right now but it’s a desert, its water supply is limited, and it suffered a long term drought for many years. Water allocation has to be planned in Arizona so they won’t run out. This prompted Phoenix put the brakes on development last month in places that rely on ground water.

Arizona will not approve new housing construction on the fast-growing edges of metro Phoenix that rely on groundwater thanks to years of overuse and a multi-decade drought that is sapping its water supply. …

Officials said developers could still build in the affected areas but would need to find alternative water sources to do so — such as surface or recycled water.

Driving the state’s decision was a projection that showed that over the next 100 years, demand in metro Phoenix for almost 4.9 million acre-feet of groundwater would be unmet without further action, Hobbs said. An acre-foot of water is roughly enough for two to three U.S. households per year. …

Hobbs added that there are 80,000 unbuilt homes that will be able to move forward because they already have assured water supply certificates within the Phoenix Active Management Area, a designation used for regulating groundwater.

TribLive: Drought, water overuse prompt Arizona to limit construction in some fast-growing parts of Phoenix

I’ve marked up this Google map of Phoenix to show the fastest growing areas circled in red.

Map of Phoenix, AZ metro with circles added: 5 fastest growing suburbs (screenshot from Google Maps)

Back in the 1990s I had a friend in the City of Phoenix’s economic development department who was proud to predict that, based on the city’s projected level of development, they had 75 years of water. In other words, they were OK until approximately 2070. My thought at the time was “Only 75 years?? Then what??”

Now we know. It took only 30 years to put the brakes on.

p.s. Phoenix, in Maricopa County, is one of the fastest growing areas of the U.S.; Maricopa grew 20.55% since 2010. Being from Pittsburgh, where Allegheny County grew 2.89% in the same time period, I marveled at the notion of 80,000 unbuilt homes.

(photo and map credits are in the captions, click on the links to see the originals)