7 January 2014
If you’ve listened to the weather forecasters you know we’re in the grips of a polar vortex.
At first that name confused me. I know about the single massive polar vortex that spins counterclockwise in the high northern latitudes in winter, covering 620 to 1,240 square miles and reaching into the stratosphere. Is that vortex here now?
Not exactly. We’re experiencing a polar vortex, not the northern polar vortex, though they’re related.
In the good old days before climate change, the winter polar vortex in the northern hemisphere was generally well behaved. It was a persistent, strong, cold, low pressure zone surrounding the polar high at roughly the same latitude around the globe. Its strong winds kept the jet stream in line. Nobody got too hot or too cold.
In some years — and more frequently as the Earth gets hotter — hot air from the troposphere is forced into the stratosphere and disrupts the polar vortex. The vortex becomes disorganized and may “collapse” into smaller pieces. Its winds weaken and the jet stream flaps like a flag in the breeze, as shown below:

(a) When the polar vortex is strong, the jet stream (pink band) circles the Earth in small amplitude Rossby waves. This keeps cold air in the north and warm air in the south.
(b) When the polar vortex weakens, the jet stream begins to wobble.
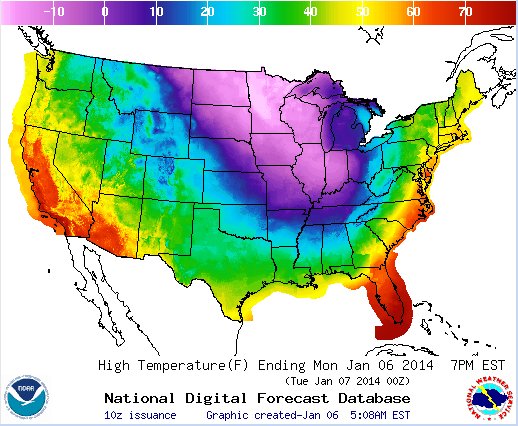
(c) A major wobble brings a tongue of polar air deep into the south, spawning a (smaller break-away) polar vortex that affects our weather. Notice how the tongue of cold air resembles yesterday’s U.S. high temperature map above.
Disruption of the winter polar vortex used to be rare, but not any more. Last winter the polar vortex completely collapsed because of hot air from the Himalayas. The vortex broke into pieces, one of which hovered over Siberia. The jet stream went wobbly. Europe had a very severe winter.
This year it’s our turn.
A lot of factors created today’s weather pattern but, yes, the weakening of the polar vortex can send us a polar vortex.
Right now only the snowy owls feel at home. 😉
(images from NOAA and Wikimedia Commons. Click on each image to see it’s source)
UPDATE, 10 Jan 2014:
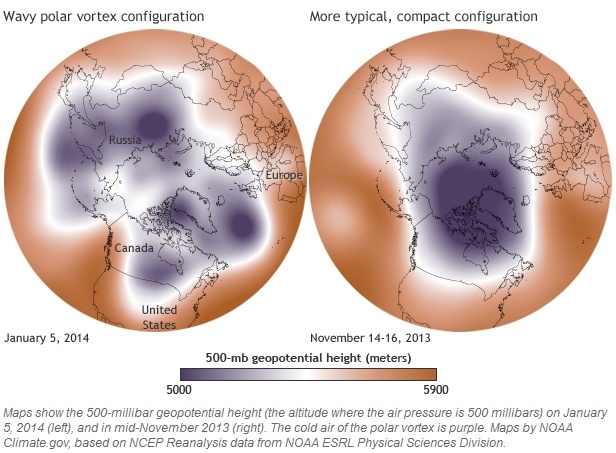
NOAA maps show the break-up of the polar vortex. On the left, the 500mb pressure gradient on 5 Jan 2014 shows the polar vortex in bits and pieces. On the right, the same pressure gradient on 14-16 Nov 2013 shows a nicely contained vortex. Click on the image to see larger images and read the accompanying article at NOAA.
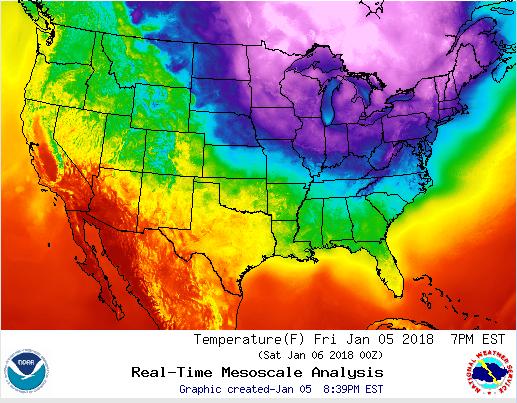
UPDATE, 6 Jan 2018:
Another polar vortex, even more severe! A great resource for future reference: Climate Reanalyzer temperature anomaly maps from climatereanalyzer.org.
This blog from Grist explains the vortex, too.
http://grist.org/climate-energy/why-the-arctic-is-drunk-right-now/
Nicely done , Kate. It will help in my explanations to the people
currently poking fun at me about ” global warming”. They, the
underinformed- misinformed are positively giddy right now.
Ditto George!! I’ll be using Kate’s blog for the same purpose! 🙂
Supporting evidence from NOAA this week:
http://www.climate.gov/news-features/event-tracker/wobbly-polar-vortex-triggers-extreme-cold-air-outbreak
And the Climate Re-analyzer from the Climate Change Institute at University of Maine, Orono: http://cci-reanalyzer.org/DailySummary/index_ds.php#